Calculating R-square values for two LME models with R

Calculating Rvalues cannot be done immediately (as far as we’ve looked) in R for LME models. Thanks to Corine Horsch we followed a method found in this book and created two functions to immediately calculate R2, which you can see below:


getRSquare <- function(Model0, Model1){

  #Variances
  sigma0SQ <-Model0$sigma^2
  tau0SQ <- diag(sqrt(getVarCov(Model0)))^2
  sigma1SQ <-Model1$sigma^2
  tau1SQ <- diag(sqrt(getVarCov(Model1)))^2

  Rsquare <- 1 - ((sigma1SQ+tau1SQ)/(sigma0SQ+tau0SQ))

  return (Rsquare)

}

In models with nested random effects, the function getVarCov() may not work. We then have to resort to a sneakier way of getting the tau value, using the more generic varCorr() function:


vc.Model0 <- VarCorr(Model0)
tau0SQ <- as.numeric(vc.Model0[4,2])^2
vc.Model1 <- VarCorr(Model1)
tau1SQ <- as.numeric(vc.Model1[4,2])^2

Note here that we are accessing a table at a certain cell: [4,2]. If you print vc.Model0 or vc.Model1 out, the cell at the 4th row/2nd column corresponds exactly to the tau value relevant to the inner nested random effect. To get the outer one for example, you should use cell [2,2]. Experiment with this table to understand better how to access the right cell for models with several nested random effects.

Conflict resolution initial findings #1: which values and norms matter the most when it comes to sharing location?

I’m still quite busy analyzing the large dataset (~1600 cases) collected from the conflict resolution online user study conducted earlier this year. Before delving into detailed model building, and findings related to specific types of normative conflicts, I thought I’d present two simple yet quite clear findings that appeared upon the initial inspection of the data:

1. Which of the five values in the experiment were found to matter the most, in the general sense?

We have asked participants to use a pie chart to indicate, in the general sense, and assuming a role (either a parent or a child), their preference for five human values that we found to matter the most in the location sharing domain. Below was the description we provided for these values.

Friendship: for you, or your family members to build friendships, a social life, and be recognized amongst others in the social circle.

Privacy: for you, or your family members to be free from unwanted outside intrusion, and undesirably shared information.

Safety: for you, or your family members to be free from dangers or harm.

Independence: for you, or your family members to be capable of doing what they need to do without other’s control or support.

Responsibility: for you, or your family members to know and be able to do the tasks they’re expected to do.

The pie chart below shows how, on average, users ranked the importance of these values:

Rplot1.png

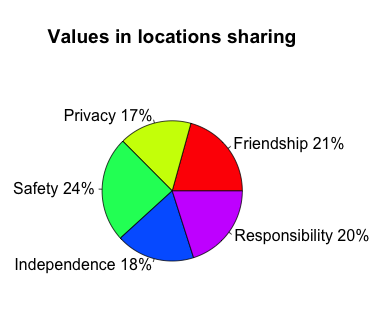
What I find interesting is that (1) the fact that there was a significant preference for some values over others and (2) that privacy, long considered a pivotal value in social data sharing (especially location!), was ranked lowest. Now, the domain of the experiment is indeed family life, so that makes this finding a little less surprising, yet still interesting as privacy ranked last amongst all five values, not just second to safety, the expected winner.

2. Obligations vs. Prohibitions (to share and receive data)?

Throughout the experiment we asked participants to create conflicting normative statements regarding sharing and receiving location, and we then asked them to indicate their preference (and by how much, using a slider), in the case a conflict occurs. Now, a conflict always included an obligation commitment (e.g. I want someone to share/receive data with/from me/somebody else under some circumstances), and a prohibition (e.g. I want someone to not share/receive data with/from me/somebody else under some circumstances). Again, before going into details on predicting user preference using statistical models, another simple yet clear finding presented itself upon early data inspection:

Rplot2.png

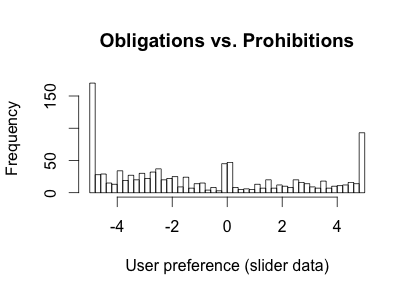
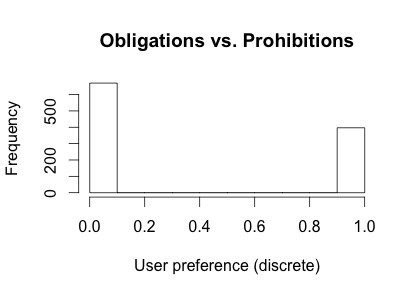
Data here was modified so that all obligations are to the left side (negative values), and all prohibitions are to the right side (positive values). In the experiment itself the order of course was random. We can see that there is a clear tendency for obligations of sharing and receiving data to be preferred to prohibitions. If we make this discrete, obligations were preferred around 63% of the time:

Rplot3.png

So, and without drawing any detailed conclusion yet, these two simple findings could alone increase prediction accuracy in conflict resolution in location sharing, by quite some margin.

Website for conflict resolution user study is now online!

We have at last finalized the website for the conflict resolution user study mentioned here, and it is online now for anyone to participate. We have also launched a campaign on Microworkers.com to add more participants. You can check it out at:

http://ii.tudelft.nl/~alexk/ConfRes

Don’t forget to watch the instructional video(s)!

Experiment: can human values be used as predictors for solving user-created normative conflicts?

Motivation and objective

Previously we showed that social commitment models could play an important role into making social applications more adaptive/intelligent, and better promote user values in that domain. However, social commitments are norm-based, conflicts may occur and they need to be resolved.

Many conflict resolution approaches exist in literature, but they are rather concerned with the “how” rather than the “why”, i.e. how to implement a certain conflict resolution policy, rather than what that policy contains. We are proposing that, given a user’s value profile (i.e. order and/or preference of a number of relevant values), and how that user believes certain commitment are relevant to the same set of values, that we can predict the user’s preferred solution if a conflict is to occur involving any two of these commitments. The importance of this is that, assuming we were able to predict the correct solution for a majority of conflicts, that social media platforms can use contextual data to automatically solve conflicts between privacy/newsfeed settings created by the user in the future.

Relevant values

Using Rokeach’s value survey as a basis, we select a sample of potentially relevant values. This is not meant to be comprehensive list of all values possibly involved. The interpretation of these values here is generalized, and participants may as well project their own interpretation over the ones provided.

• Safety (Rokeach: family security)
For one or members of one’s own family to be safe from dangers or harm.

• Independence/freedom
For one, or members of one’s own family to be capable of doing what they need to do on their own, without being dependent on others.

• Social recognition/friendship
For one or members of one’s own family to build true friendships, a social life, and be recognized or distinguished amongst others in their social circle.

• Privacy (not in Rokeach’s list but relevant)
For one or members of one’s own family to have important information about them only shared with those they agree to share it with.

• Responsibility
For one or members of one’s own family to act responsibly in situations where that is required.

• Peace of mind (Rokeach: inner harmony)
For one or members of one’s own family to live with few or no worries and/or disturbances.

Hypotheses/research questions

H1: users’ value profiles in addition to how they believe certain commitments relate to their values can predict/explain the preferred conflict solution.

RQ2: will users have preferences regarding conflict solutions that deviate significantly from the “no difference” point?

RQ3: Is there an association between the agreement type (i.e. its elements) and the value profile associated to it? (E.g. location and privacy)

RQ4: users will have no significant preference for one value over another in their value profile.

…to be continued.


Specifying correlation matrices for longitudinal models in R

Specifying correlation matrices in various data analysis packages for longitudinal data in R (e.g. geepack, nlme) can be quite confusing, especially if the model converges with its default correlation matrix and therefore subjecting your analysis to certain assumptions. Here are various ways you can specify a correlation matrix, depending on the package.

In geepack, you can use the variable “constr”:

gee.model <- geeglm(response ~ fixed, id = rand,
data = yourData, family=gaussian, corstr="unstructured")

In nlme, it can be a little more complicated. You can start by specifying and initializing the matrix:

corMatrix <- corSymm(form = ~1|rand)
corMatrix <- Initialize(matrix, data = yourData)

And then, you can assign the initialized matrix to your model. Note that there has to be a match between the formula in your matrix and the random effect structure.

lme.model <- lme(response ~ fixed, random = ~1|rand,
data = yourData, correlation = corMatrix)

p.s. The R package “lmer” still, as of the writing of this post, does not support a custom correlation matrix.

Pie chart with interactive resizable slices

We recently needed to elicit user values within a quota limit. The idea of an interactive pie chart with draggable slices came to mind, but somehow it appears that no such code exists in JavaScript (one exists using a Java applet, but we didn’t want to use that). We created our own therefore, based on this package, and though not draggable by the slice, you can still use your left mouse button to click on a slice to increase its size (affecting the next slice clockwise only), and the right mouse button to decrease it. Code is available on this JSFiddle for you to check out or even manipulate!.

Journal Article: Electronic Partners for Improved Support of User Values

Currently writing my second journal article. This article highlights that location sharing apps, especially in the family domain, need to provide a better support for a certain set of domain-related user values (e.g. family security, friendship, social recognition, and independence). The article relies primarily on the series of  user studies at the day care centers, which I wrote about earlier here, here, and here. It picks up from the results of first paper which evaluated a social commitment model’s usability and usefulness, and goes on to show that location sharing apps augmented with such a model, i.e. “electronic partners”, can provide enhanced support for user values.

Workshop on sustainable entrepreneurship

Participated in two-day a workshop offered by the Graduate School of TU Delft, and took place at the Yes!Delft incubator. Topics included business model generation, business canvas, team-building challenges, lean startup, success/failure stories, etc. Participants (all doctoral students at the TU Delft) were divided into teams of 4, and each team had to pick one of the research topics of the group members to try and turn it into a business idea.

Our team picked a topic that was quite far from what I do: building vegetation (the vertical type that can be attached to the outside of a house or a building), that saves energy, prolongs the life of the building, provides better isolation (and thus reduces energy costs) and cleans the air from certain harmful material.

It was quite interesting that, despite the fact the remaining team members had no experience on the topic, we were able to contribute quite well to the business model/canvas, gaining traction, and ideas for generating profit. See photos below! (Full of post-its).

IMAG0066 IMAG0063 IMAG0065

Mixed models with nested random effects in R

Once again, SPSS failed me miserably while trying to run my mixed, multilevel model below:

nested model

The first two levels, BSO(i.e. day care center) and pp (participant) are nested random effects. As the model shows, each participant’s “emotional” or behavioral code (e.g. engaged, excited, bored, …) was sampled several times, during two sessions (once for each of the app’s two versions). SPSS failed to allow me to build this model properly, mostly failing to comprehend that random effects have more than one level.

So I turned to R and found several, very interesting (though maybe a bit long to read) tutorials using the package lme4, so credit goes to Bodo and Ben for their extensive effort into simplifying what could be a very complex process.

The way it worked for me is below, described in an overly simplified way.

require(xlsx) #to read excel sheets
require(lme4) #the package
Behavioral <- read.xlsx("behavioral", 1) #the data set

#certain things we need to ensure are treated as factors
#default is covariants
Behavioral$version = as.factor(Behavioral$version)
Behavioral$pp = as.factor(Behavioral$pp)

#first we construct the null model
#emotion type as response with no fixed factors
#and a nested BSO and pp as random factors
model.null <-lmer(emo.type ~ 1 + 1|BSO/pp, data = Behavioral, REML=FALSE)

#we then construct our model, adding version as fixed factor
model <-lmer(emo.type ~ version + 1|BSO/pp, data = Behavioral, REML=FALSE)

#see summaries of the models here
summary (model.null)
summary (model)

#to obtain the p-value, i.e. to see if adding
#the fixed factor made a significant difference
anova(model.null,model)

#and finally
citation("lme4")
#will generate a bibtex entry so you cite the authors of the package!

Journal article: “A social commitment model for location sharing applications in the family domain”.

Just submitted a journal article titled “A social commitment model for location sharing applications in the family domain”, to the International Journal of Human Computer Studies (IJHCS). In this article I discuss the creation of the social commitment model and lifecycle (see photo below), throughout the conception phase, evaluation through CCS, then the enhancement, creation of an alternative lifecycle, and then evaluation results using SWT.

Will update this post with a preliminary version once it’s been published. If you would like a copy already, leave a comment with your email.

sc-model